Data lifecycle
Bio300B Lecture 1
Richard J. Telford (Richard.Telford@uib.no)
Institutt for biovitenskap, UiB
17 August 2025
Why do biologists need statistics anyway?
Why do YOU need
data handling skills
data visualisation skills
statistics skills
Biology is applied data science!
Nearly all papers include data visualisation and analysis
Need to be able to understand the methods used to evaluate paper
Need to be able to make visualisations and analyses for papers, reports, theses
Data life-cycle
circo
a
Design
b
Gather
a->b
b2
Enter
b->b2
b3
Import
b2->b3
d
Clean
b3->d
e
Visualise
d->e
f
Analyse
d->f
e->d
e->f
g
Communicate
e->g
f->d
f->e
f->g
h
Archive
g->h
i
Death
g->i
j
Find & Reuse
h->j
j->b3
Experimental Design
Lecture 5
Observational studies vs experiments
Randomisation
How many replicates do you need?
Statistical traps
Data entry
Make your data easy to import.
Proof read & data validation
Lock data file. No more edits.
Examples
When is 1-9-2021?
Sex coded as 0 & 1
Data importing
R can import almost any data type.
CSV files with readr
Excel files with readxl
shapefiles with sf
NetCDF with ncdf4
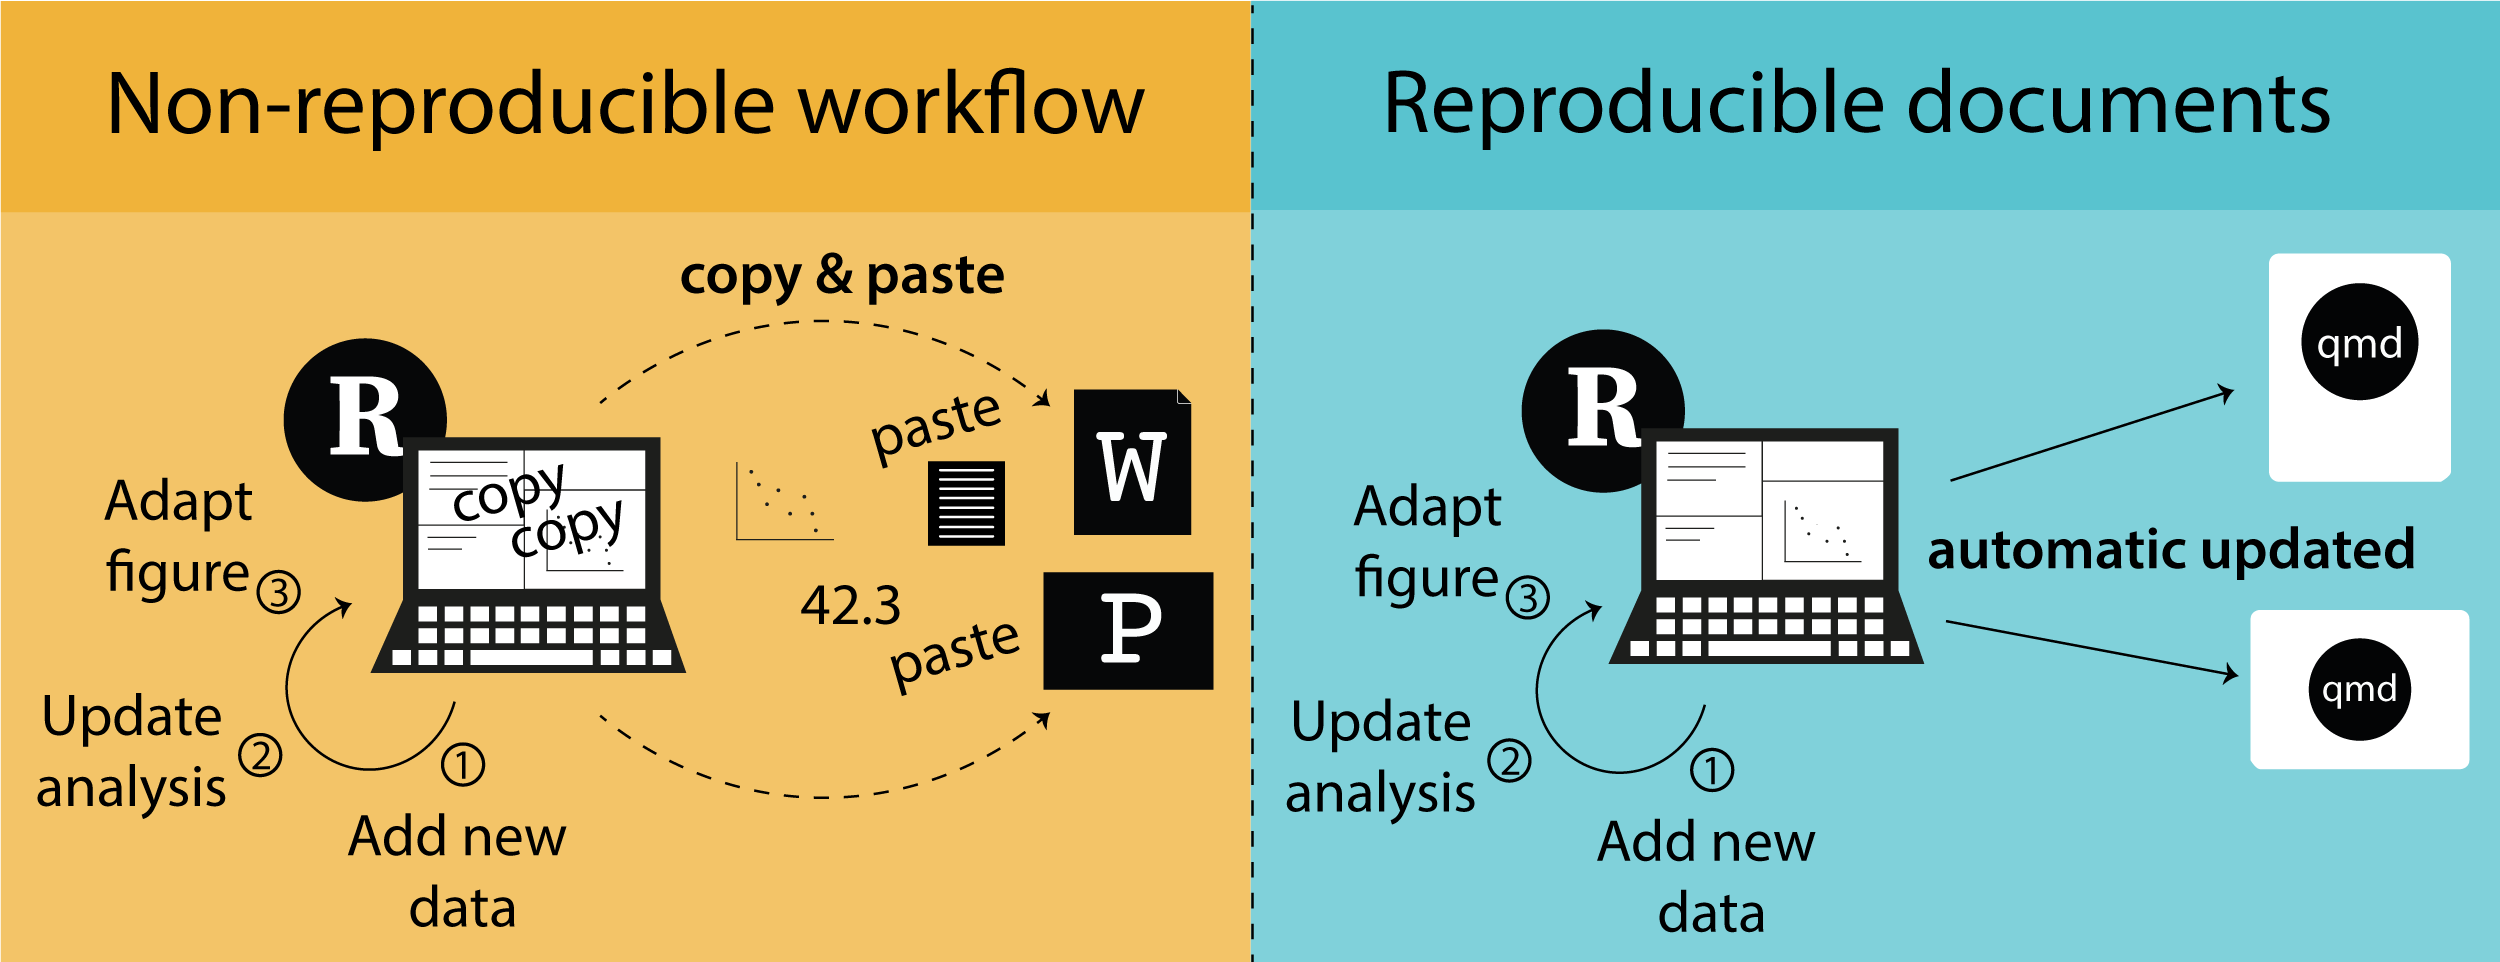
Data cleaning
Process your data with code
Reproducible analyses
tidyverse (Lecture 3)
library (tidyverse)data (penguins, package = "palmerpenguins" )|> group_by (species) |> summarise (n = n (),mean_mass = mean (body_mass_g, na.rm = TRUE ))
# A tibble: 3 × 3
  species       n mean_mass
  <fct>     <int>     <dbl>
1 Adelie      152     3701.
2 Chinstrap    68     3733.
3 Gentoo      124     5076.
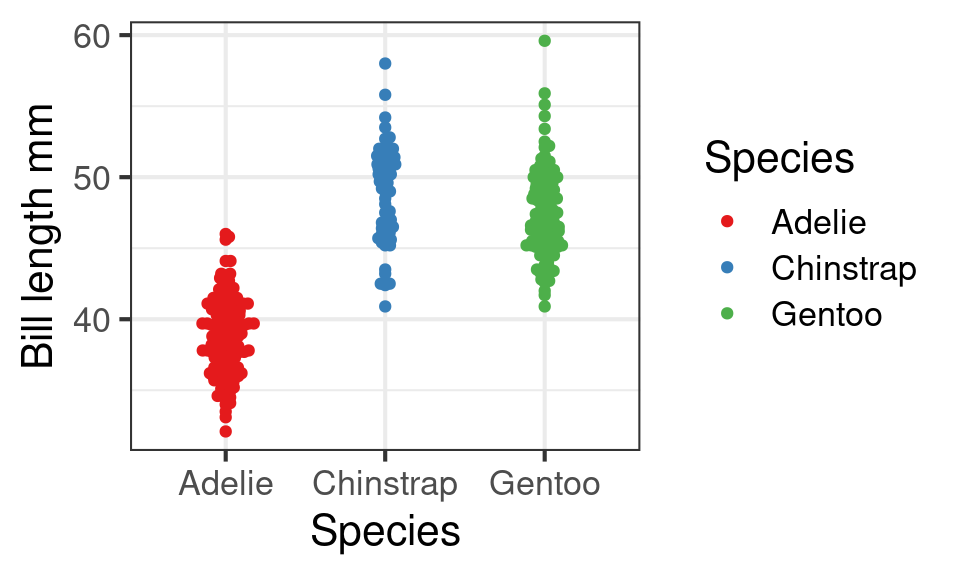
Visualise with ggplot2
library (ggplot2)library (ggbeeswarm)ggplot (penguins, aes (x = species,y = bill_length_mm,colour = species)) + geom_beeswarm () + scale_colour_brewer (palette = "Set1" ) + labs (x = "Species" , y = "Bill length mm" , colour = "Species" )
Data analysis
Huge number of statistical methods
This course will focus on
Exploratory data analysis (6)
Descriptive statistics (6)
Linear models (7--8)
Generalised linear models (9)
Mixed effect models (10)
Survival analysis (11)
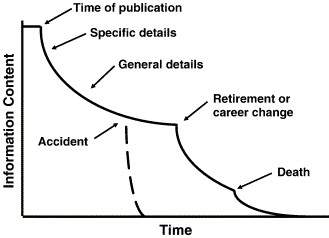
Data death
Natural degradation in information content associated with data and metadata
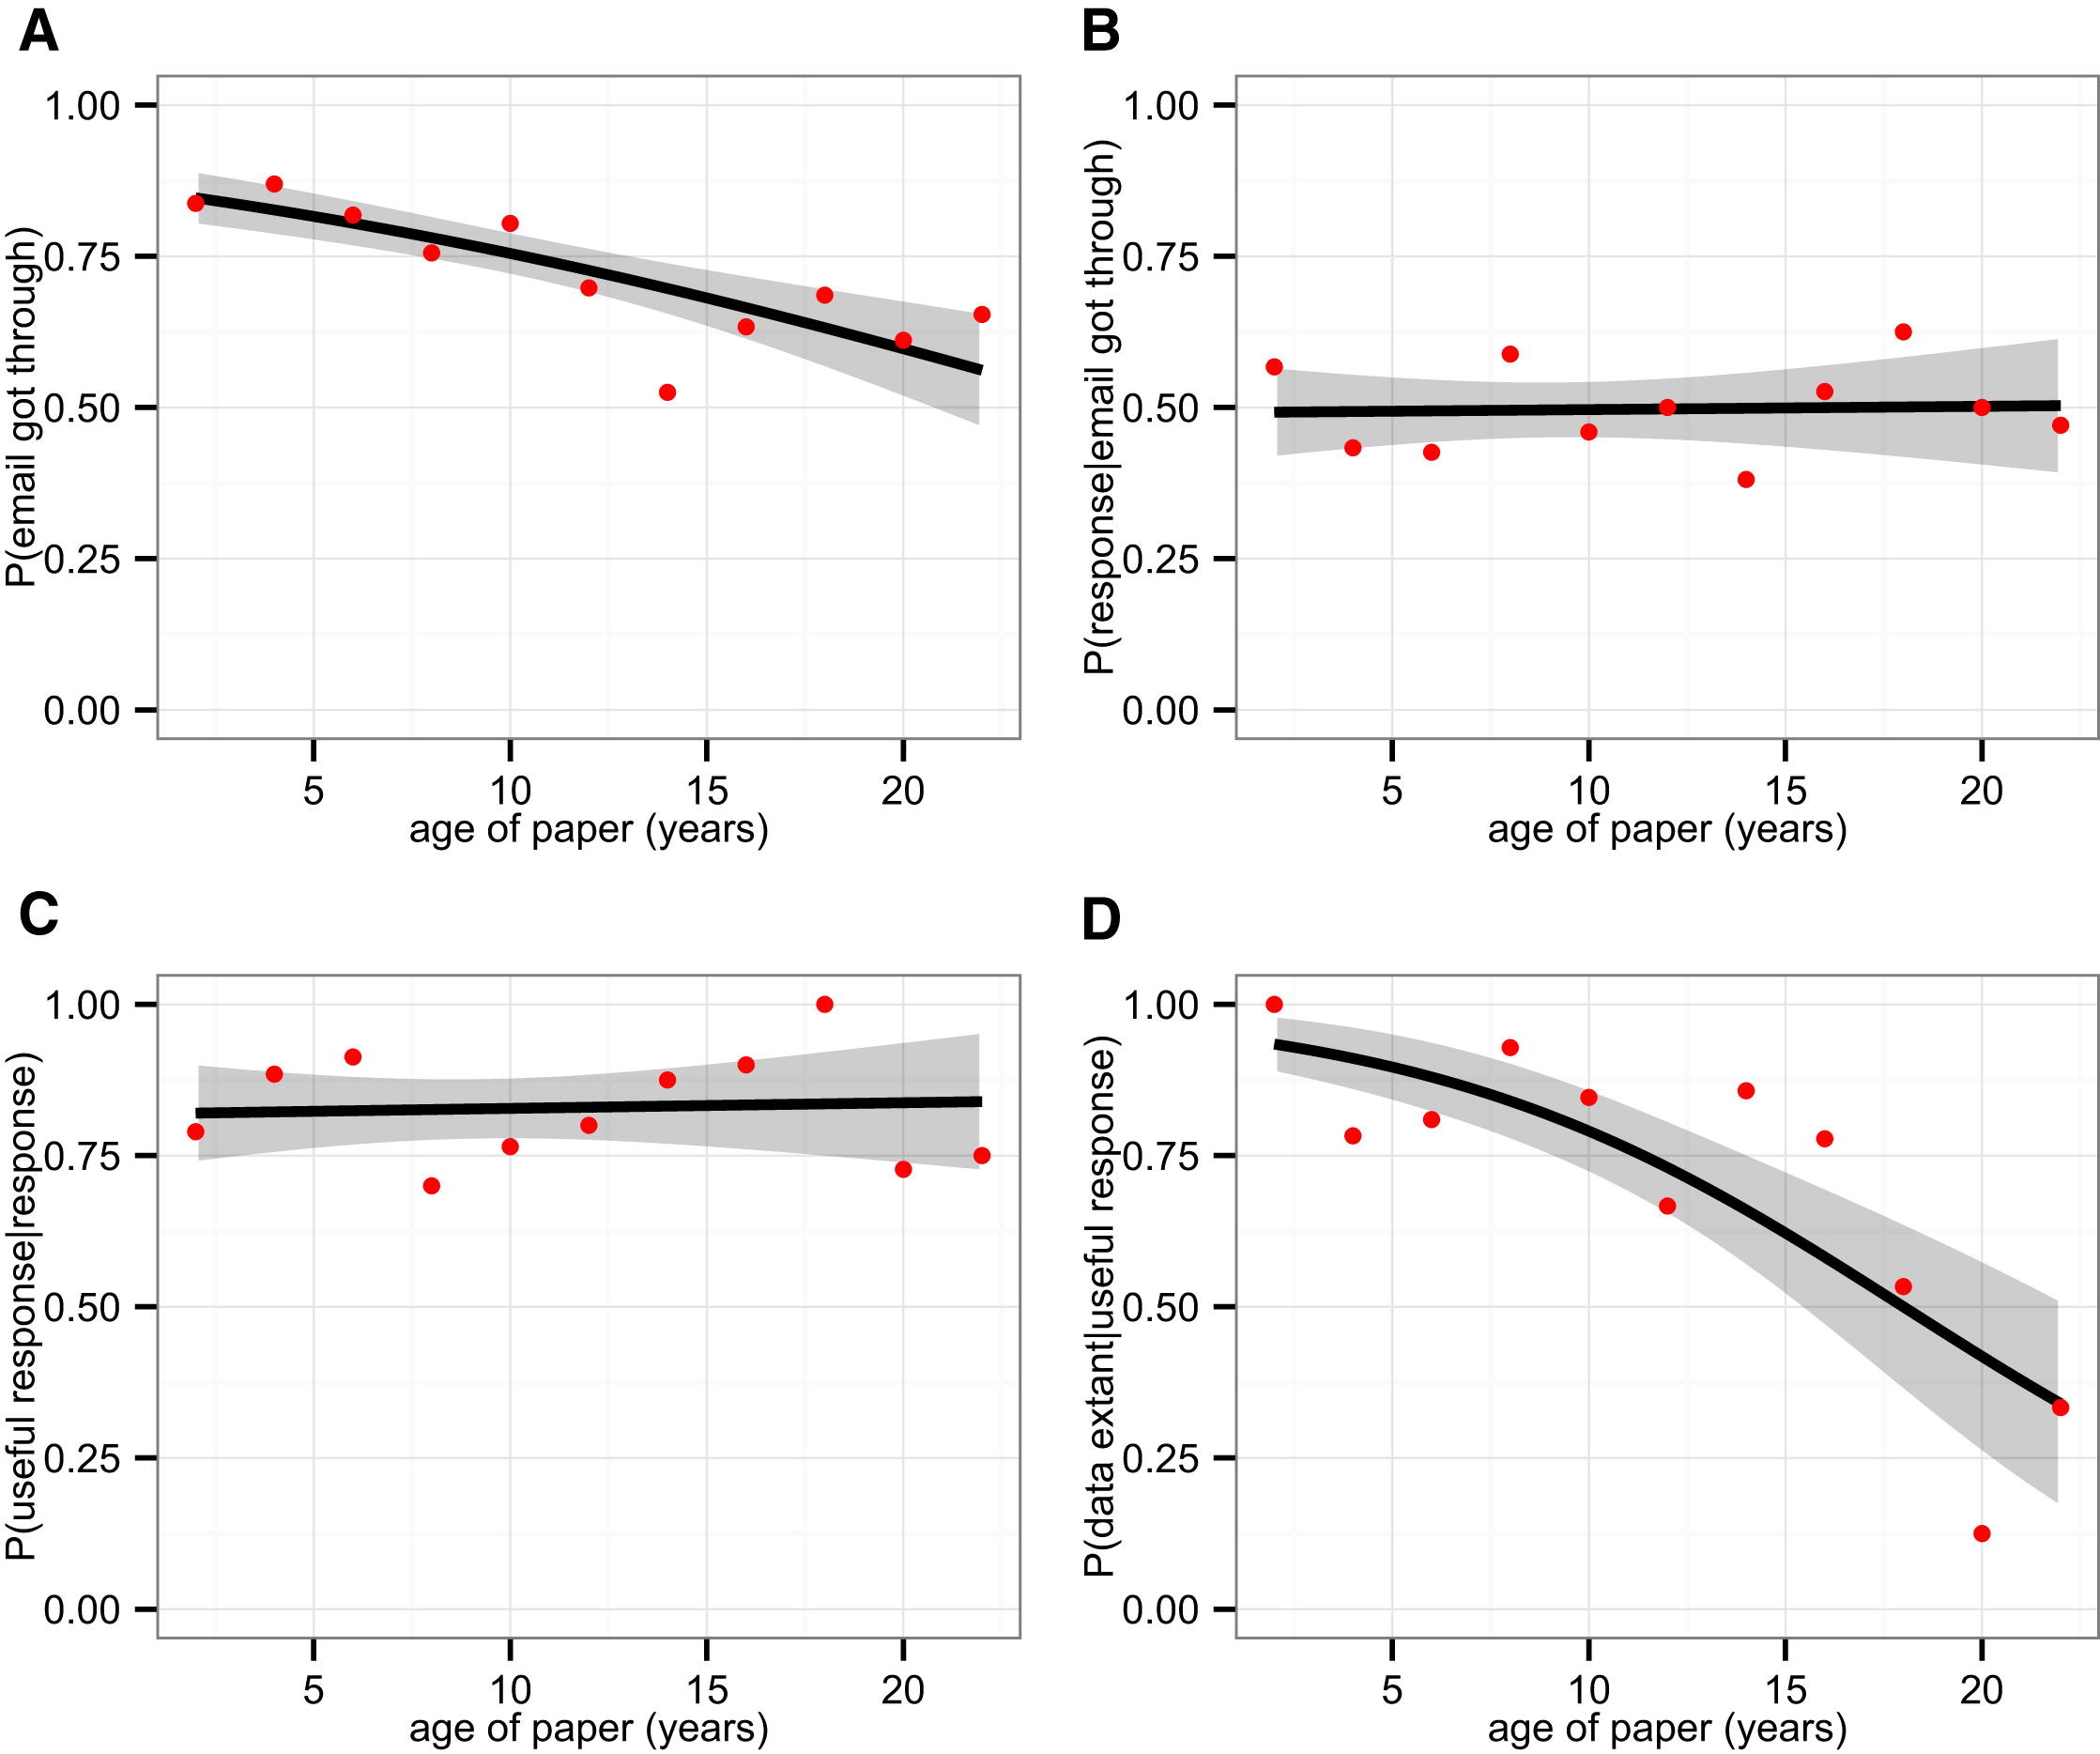
Empirical evidence of data loss
morphological dimensions from plants or animals
examined the availability of data from 516 studies between 2 and 22 years old
The odds of a data set being reported as extant fell by 17% per year
Broken e-mails and obsolete storage devices were the main obstacles to data sharing
Policies mandating data archiving at publication are clearly needed
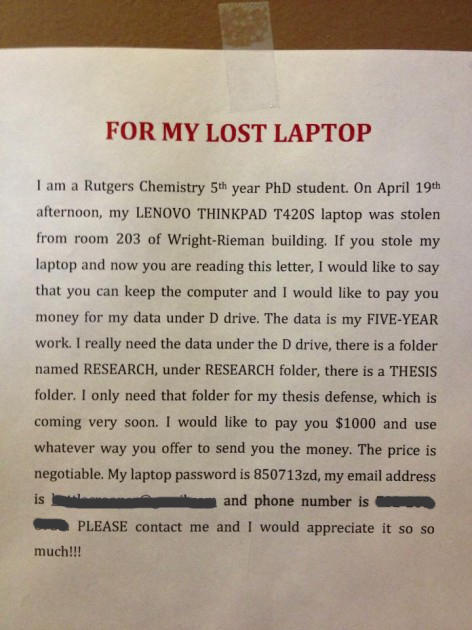
What would happen if you lost all of your research data?
I was focussed on creating high resolution, 3D time lapse videos of developing crustacean embryos, so all of my work was digital-based. When I lost my laptop and backups, I lost 400GB of data and close to four years of work.
Obsolescent storage equipment
Back up your raw data!
Keep raw data
Multiple places
Physical and cloud services
Be paranoid!
Archiving data
Many research funders and journals demand data archiving.
subject specific archives
Generalist repositories
University based
Special problems
Sensitive data
Data management plans
How data are to be collected and handled both during a research project, and after the project is completed
Write one before you start work.
FAIR principles
Findable
Accessible
Interoperable
Reusable
Meta data is as important as data.
Metadata is structured information that describes, explains, locates, and makes it easier to retrieve and use an information resource.
Why
free
open source
large and friendly user community
many statistical methods implemented
makes publication ready figures
reproducible research
code is easy to share and publish.
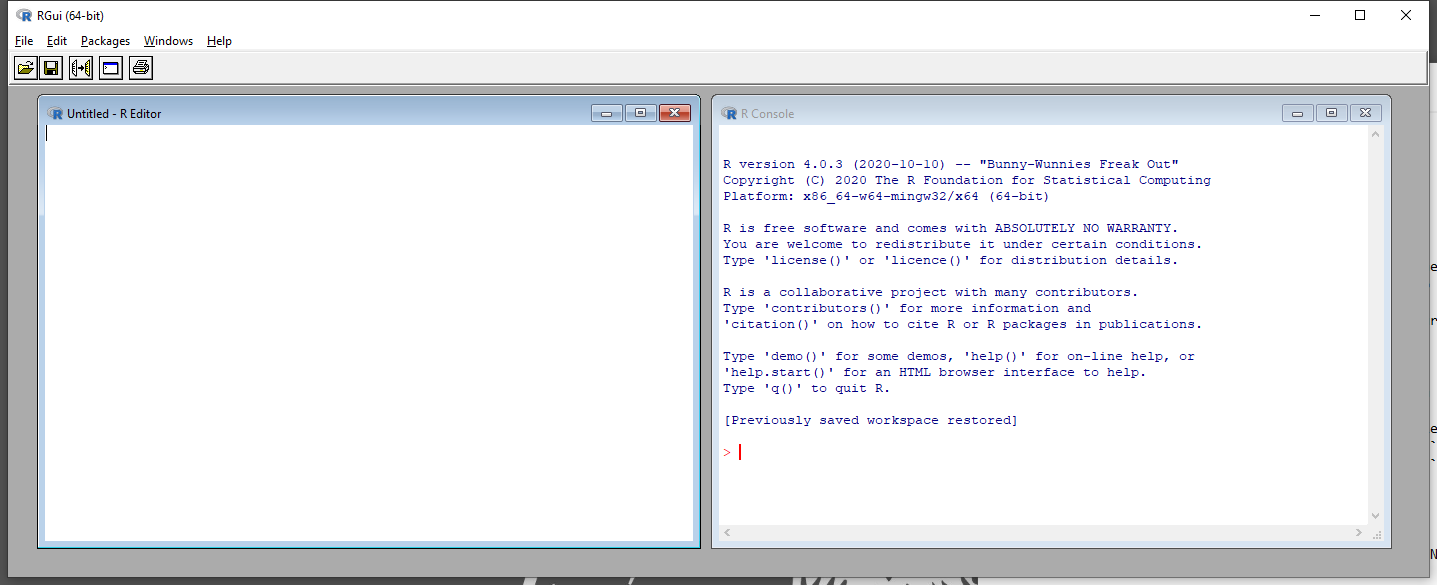
R GUI
You probably never need to open R directly.
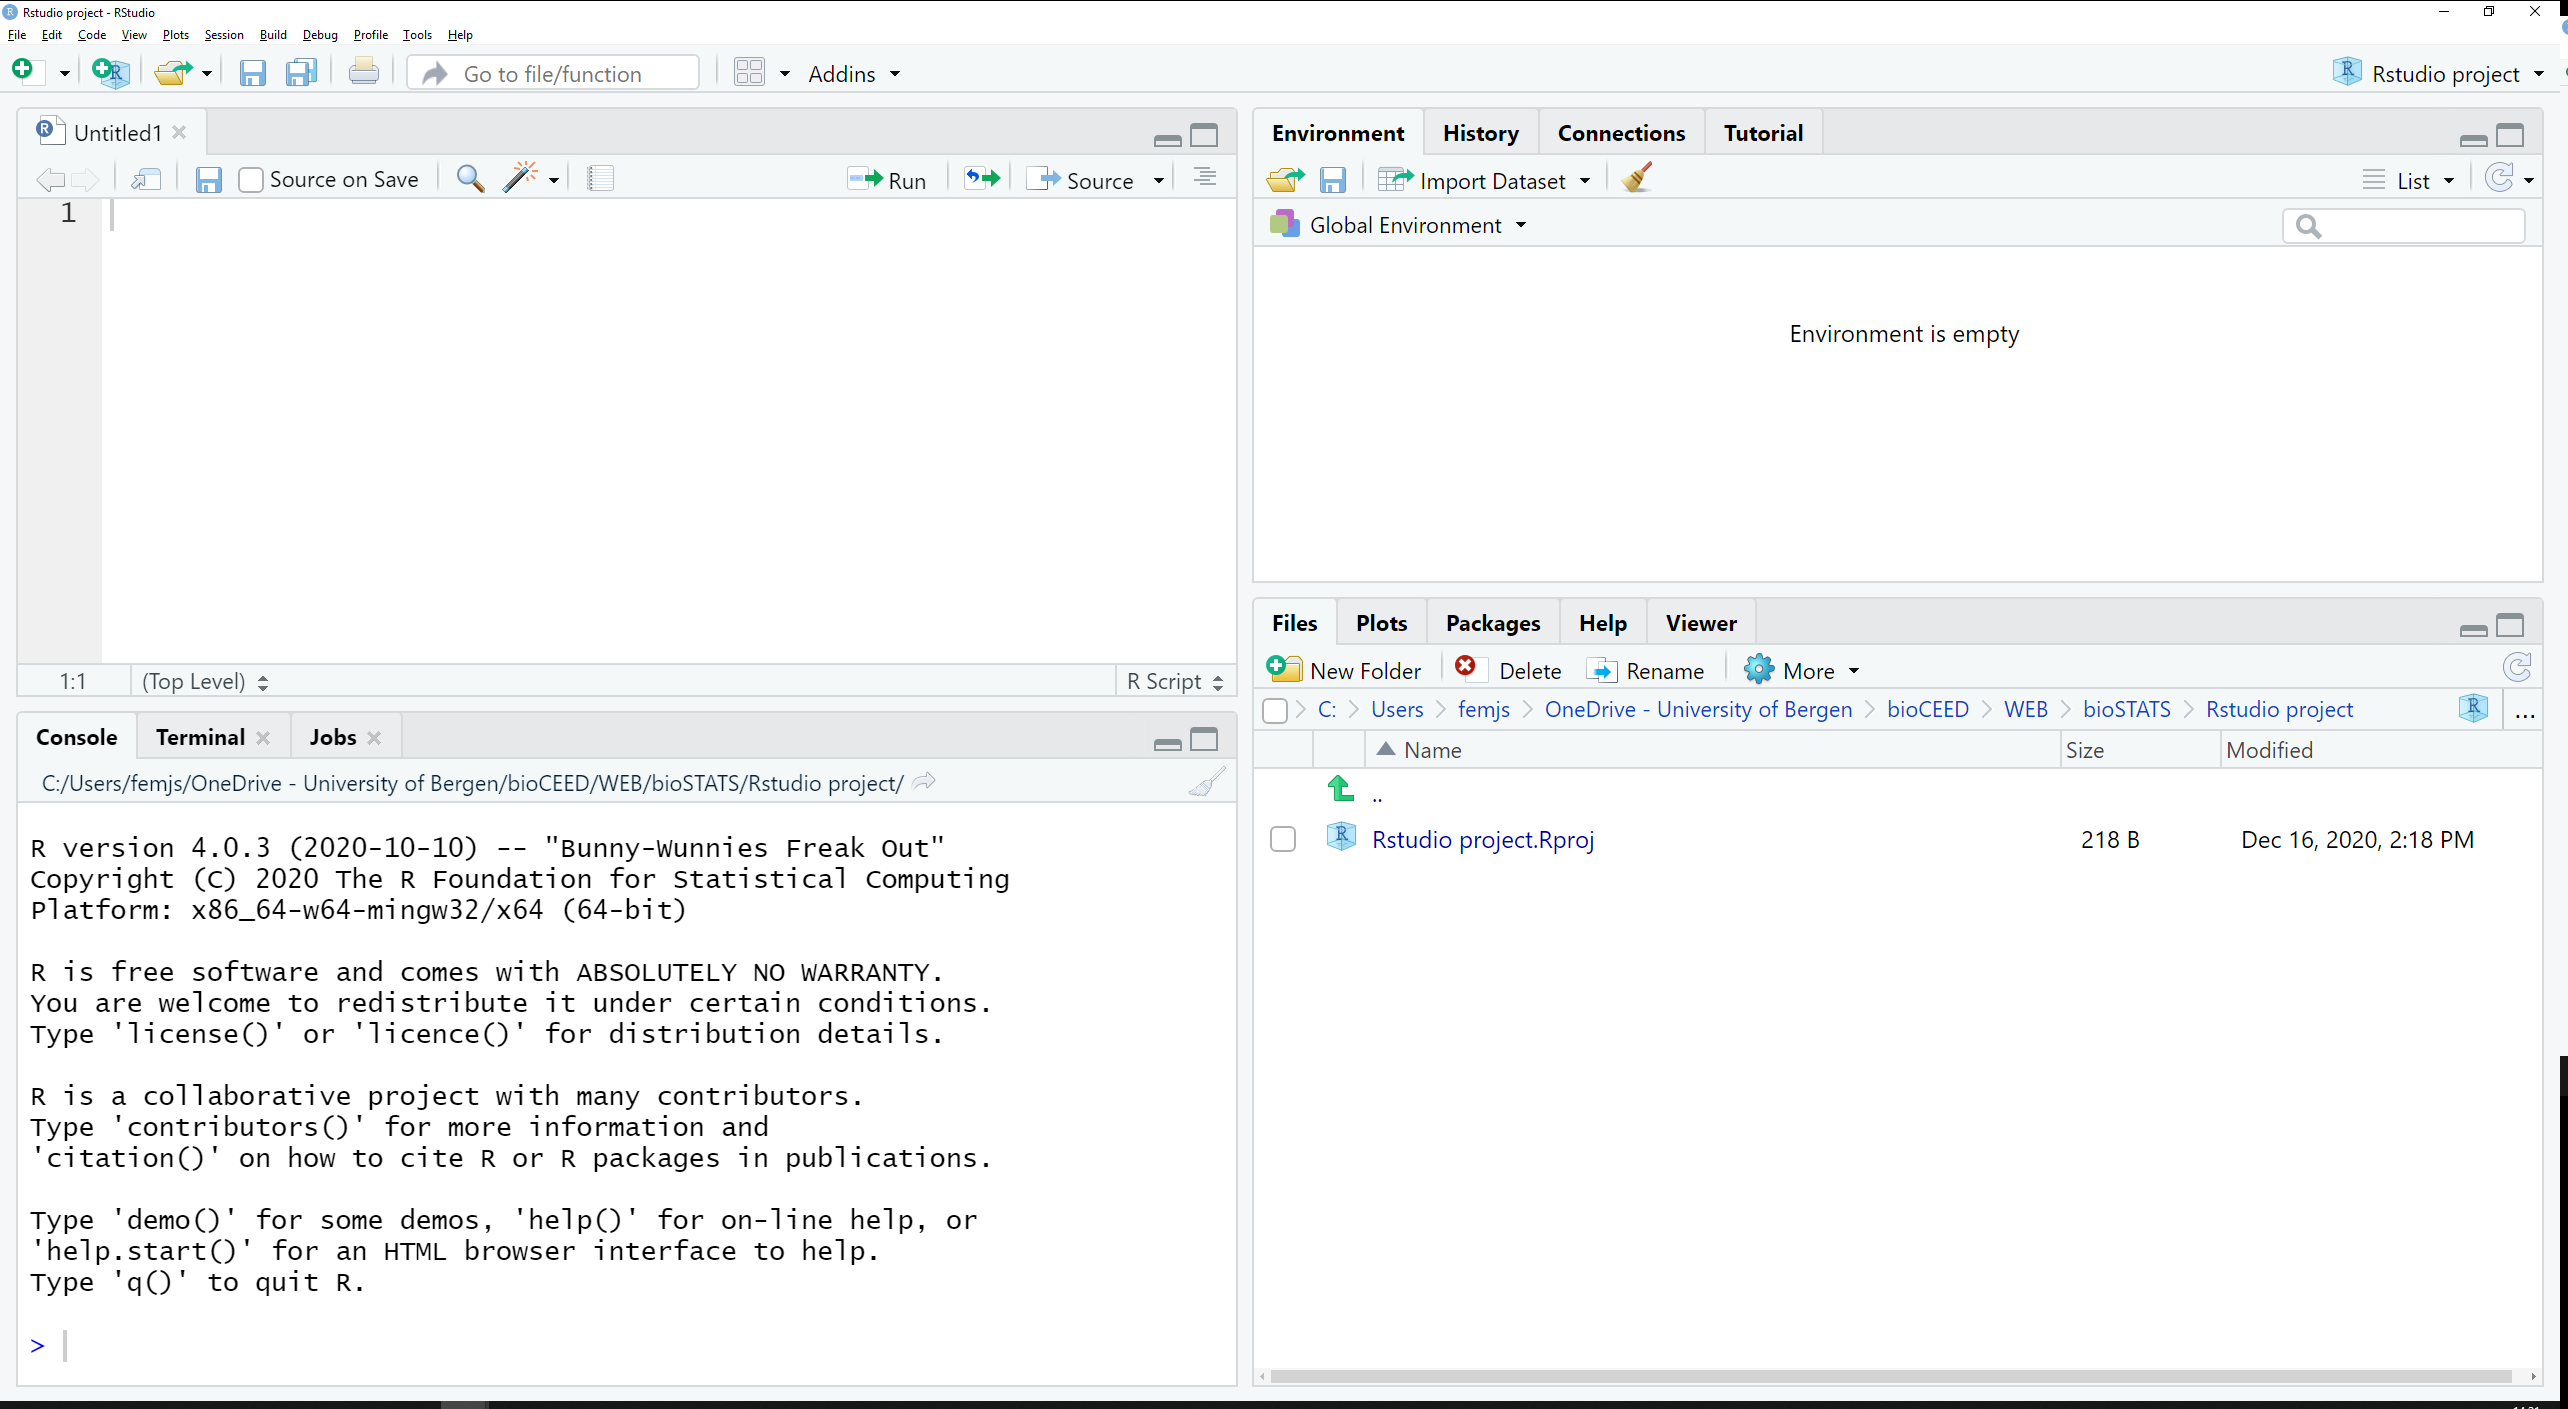
RStudio IDE
Getting the best out of RStudio
projects
keep track of everything
code completion
bracket matching
Getting help
?length - find function length in open packages
??length - help search
Stackoverflow.com
Google error messages
AI
ChatGPT
Phind
Copilot Need github account. Copilot is free with student account.